Measure smarter, not harder

Summary
Social media is increasingly an indispensable part of any brand. In 2023, it’s estimated that online sales are expected to break $6 trillion, with many of those customer journeys driven by
social media. This reality means that the money your business is spending on social media needs to accomplish what you set out to do. And getting there all comes down to ROI—your return on investment. We dive into the nuances of calculating your social media ROI in monetary and non-monetary terms. You’ll see where your spend is most effective, and where you should reallocate your budget.
Part two of a two-part series on that most elusive of questions: “I know my company needs to be on social media, but is it worth it?”
In part one of our two-part story on building successful social media campaigns, Spend Smarter, Not Harder, we looked at the first step in creating a holistic social media strategy: figuring out what you want to achieve and setting actionable goals based on that. Now, we’ll explore how to measure the return on investment (ROI) on those campaign goals.
Online sales continue strong
Social media ad campaigns have proven to be one of the most effective ways to generate leads and convert potential customers, especially for small businesses that operate online (a trend that exploded in 2020–2021). Shopify Plus predicted global ecommerce sales to hit $4.9 trillion in 2021. Statista projects this to grow to $6.5 trillion by 2023.
With an increase in users online, that’s bound to happen. Datareportal found that the number of social media users grew by 10.5 per cent in 2020; as of July 2020, social media users numbered 3.96 billion worldwide. And Hubspot’s 2020 Marketing Statistics study found that marketers report the highest ROI from Facebook and Instagram.
Understanding ROI
It’s crucial to know how to measure campaign effectiveness and assign a dollar value to your ad spend, especially when you increase that spend.
And yet, “ROI” and “conversion” are terms that are thrown around a lot, often without a clear idea of what they mean. A Google Trend chart shows an uptick in searches of the term “conversion rate optimization” since 2019. Of Hubspot’s surveyed marketers, about 75 per cent actually do any reporting on how campaigns influence their revenue; and only 35 per cent of those surveyed said that they think understanding ROI was important.
Social media ROI is the amount or percentage value of results (benefits) on all the spend or investment (costs) in online campaigns; this includes organic content, too. As we pointed out in part 1, how you measure—and define—ROI ties in directly with your campaign objectives. There are two ways to think of this:
- In terms of monetary value: for results that can be considered in dollar value, like the number of conversions on your website (phone calls, email sign-ups, purchases)
- In terms of effectiveness of campaigns: for the less tangible, non-monetary results, like increase in visibility or brand awareness
Before getting into what entails as cost and benefit in context of ROI, take a step back to understand your entire customer journey, from the moment they see your ad online.
Be realistic about what ads can and cannot do
Saying that your Google Ads campaign resulted in more foot traffic to your store sounds great, but it can be misleading to calculate ROI using just the amount spent on ads as “costs” and the sales at the store as “benefits.”
Try to think ahead and define the extent of realistic results an ad can produce. Think of “results” as a customer journey, rather than a funnel, starting with the most immediate reaction to your brand (a click on the ad) and then leads to more actions. The influence and impact of your ads and social media content broaden as the customer moves further from the start point.
For instance, a Google Ads campaign can encourage a customer to click on a call extension; that would be a realistic result of the campaign. Or, to measure the result of an Instagram ad with a call-to-action to “Sign Up,” you would look at the number of clicks on a CTA that lead to a sign-up page, in addition to the landing page analytics that ultimately lead to the sign up.
There are also times when an ad online can encourage a customer to check out a product on your website, but decide to visit a bricks-and-mortar store to actually purchase it. Google notes that 46 percent of shoppers check inventory online before going to a store.
Know what you’re calculating: ROAS vs. ROI
It’s important to remember that return on ad spend (ROAS) is different from ROI. When you divide the dollar value of what you spent on your ad campaign and the dollar value of the resulting conversions generated, you get the ROAS. This is the simplest method to assign a monetary value to the effectiveness of the campaign, but is not the same as ROI.
For instance, consider an online store that offers 20 per cent off for a month, promoted through a Facebook ad campaign for four weeks. If the Facebook ad directs users to click through to the store’s website, then the immediate quantifiable result is the number of clicks on the call-to-action button. Using the ad spend as cost and the dollar value of clicks, you can determine the ROAS.
However, to determine the ROI, you also have to account for all the events that happen after clicking on the ad: the customer browsing the landing page, adding items to their cart, using the discount code at checkout, placing the order. These are attributable to the ad, but are not a direct result of the ad.
This is because there are a number of factors that influence the customer once they click on the ad: they can drop off the website if the landing page isn’t appealing, if the products aren’t what they’re looking for or if they hit a technical snag during checkout. Even your website load time can be a strong influence: Portent reports that website conversion rates drop by an average of 4.42 per cent with each additional second of load time; according to Hubspot, the first five seconds of page-load time have the highest impact on conversion rates.
The more participation you require from the customer to reach your objective, the more levels you need to consider in calculating ROI.
Measuring ROI in non-monetary terms
You can measure effectiveness of campaign objectives if your focus isn’t solely on sales conversions. While you may not be able to assign a monetary value to an increase in page likes or whitepaper downloads, these are still significant metrics to consider, and they have a direct, quantifiable result.
For brand awareness, you can use reach, impressions or video views as the metric to determine this. For engagement, consider the value of likes, comments, shares, mentions, download events and page views. For lead generation, you can use signup rates.
Determining ROI in monetary terms
Step 1: Add up your costs
Start by getting numbers for how much you spent on social media campaigns, broken down by ad platforms. Add to it other internal costs or soft-dollar spend: employee hours spent on creating and reporting on campaigns, website hosting and development, software tools for reporting or analysis, even hardware and overhead costs. If your agency takes care of these tasks, you may already have a number.
Step 2: Add up your benefits
Assign a monetary value to your campaign goals. Consider the lifetime value (LTV) of a customer: how much you would earn on average per customer.
If you use Google Analytics or any other platform that provides you with a conversion rate, multiply it with the LTV to see how much a potential visit or action is worth. You can also consider average sales (what was the average purchase amount through your site?).
Step 3: Create a tracking document tracing the customer journey
Track your campaigns based on the action the customer performs. Trace how the customer moves, starting from ad visibility to the final objective. For instance, the customer journey for an online store from ad to sales would look like this:
| Customer action | Costs (including employee hours and overhead costs, in dollars) | Benefits |
|---|---|---|
| Clicking on an ad | Total campaign spend | Number of clicks on ad |
| Browsing the landing page and products | Page design, content creation, web hosting | Page views and interaction |
| Applying a discount or signing up | Setting up web analytics and tracking, page design, content creation, web hosting | Lead generation |
| Checking out or placing an order | Payment gateway setup, web hosting | Sales |

Sort the costs and benefits associated with each step, broken down by the ad campaign platform that originated the lead.
Step 4: Apply the formula
Now that everything’s documented, apply the ROI formula for each platform:
ROI = (benefits – costs) x 100 / costs
Finally, focus on the investments that work
The ultimate goal of measuring ROI is to determine what sort of investments work best, versus those that eat up money and time without producing results.
In the context of social media, a singular, total ROI percentage on its own does not reveal much about the success of your campaigns. Instead, compare the ROI for each ad platform. Even if you have a campaign on a single platform, you can still use A/B testing to compare it with different placements, landing page options and content.
If you’re able to ascertain, in terms of ROI percentage, what kind of campaign yields best results, you can make more informed decisions for effective marketing that matches your budget and saves costs.
Tools that can help track campaigns
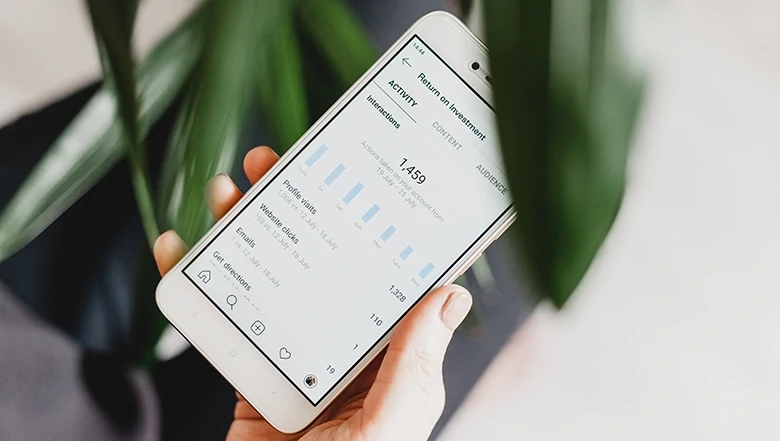
The best place to start collecting data and tracking campaigns is on each ad platform’s dashboard. Most major platforms have complex insights that provide a quick overview of costs and benefits that can be tied to your social media campaigns.
Google Analytics tracks your Google Ads (which includes paid search and display ads, as well as YouTube ads) campaigns and goals, and creates conversions for every possible action a user can perform while on the website. In addition, UTM tracking for Google Analytics assigns extensions to your landing pages to create unique links that can help track campaigns, source and medium of conversions.
For Facebook and Instagram campaigns, add the Facebook Pixel tracking to your landing pages to track how Facebook ads led to conversions.
Similarly, analytics from other ad platforms, like LinkedIn, Twitter and Pinterest, each provide their own conversion tracking and assign value to conversion actions.